PowerCenter provides an environment that allows you to load data into a centralized location, such as a data warehouse or operational data store (ODS). You can extract data from multiple sources, transform the data according to business logic you build in the client application, and load the transformed data into file and relational targets.
some important terminologies in informatica are:
Repository Manager. You use the Repository Manager to create a folder to store the metadata you create in the lessons.
Designer. Use the Designer to create mappings that contain transformation instructions for the Integration Service. Before you can create mappings, you must add source and target definitions to the repository. In this tutorial, you use the following tools in the Designer:
- Source Analyzer. Import or create source definitions.
- Target Designer. Import or create target definitions. You also create tables in the target database based on the target definitions.
- Mapping Designer. Create mappings that the Integration Service uses to extract, transform, and load data.
Workflow Manager. Use the Workflow Manager to create and run workflows and tasks. A workflow is a set of instructions that describes how and when to run tasks related to extracting, transforming, and loading data.
Workflow Monitor. Use the Workflow Monitor to monitor scheduled and running workflows for each Integration Service.
Friday, January 22, 2010


Monday, January 18, 2010
Starting with tools in DWH
Data Warehouse is repository of Data picked from Transaction systems, and filtered and transformed to make it available for data analysis reporting.
Data-Warehouse is a repository of Data, which can provide most OR all of the Data and information requirements of an enterprise. It means that it pulls data from all the production and other sources. Once the data is pulled onto an offline staging area, it is cleansed, transformed and loaded into a sanitized, uniform and well-organized manner so that you can run queries, reports and all kind of analysis on the data.
There are a number of important tools which are connected to data warehouses, and one of these is data aggregation.Data warehousing requires a hardware platform, database, data loading method (ETL tools), and data extract method (reporting and business intelligence tools). Informatica is a famous ETL tool and Buisness Object is a reporting tool..
Tuesday, December 15, 2009
Data Analysis Tools
Data analysis tools are used to perform complex analysis of data.They will normally have a rich set of analytic functions,which allow sophisticated analysis of data.These tools are designed for buisness analysis.
Data analysis tools can again subdivided into MOLAP tools and ROLAP tools.They came into existence because the term OLAP(On-Line Analytical Processing)has become an industry buzzword.
On-Line Analytical Processing is a decision support software that allows the user to quickly analyze information that has been summarized into multidimensional views and hierarchies.
On Line – Emphasizes live access to data, not static reporting
Analytical Processing – Ad-hoc queries, drill-down, roll-up, reporting across various dimension.
OLAP databases are also known as multidimensional databases or MDDBs.
Multidimensional analysis is a technique whereby data can be analyzed in many dimensions at once.The term dimension here means an attribute such as cost,duration or name.They are equivalent to a column in a relational table.The idea is that instead of analyzing the data in a two-dimensional table,the data is loaded into a multidimensional hypercube to be analyzed.
MOLAP(Multidimensional OLAP) tools have an SQL interface that allows them to extract data from a relational database.On a predefined set of data,MOLAP gives userfriendly,fast access to poweful analytical and statistical functions.They are good to use for analyzing aggregated data with the dimension data.It do very well in dimensional slicing.if data has been loaded into the cube dimensioned by office,region,sales-quantity,sales-value and product,the tool will be able to switch from displaying data by region to displaying data by product or by sales-value.
ROLAP(Relational OLAP) are the traditional SQL-oriented tools that have tight integration to the relational model.They are changing all the time.They use metadata to isolate the user from the complexities of the data warehouse,and to present a buisness perspective of the data.They can be used as data browsers,and will have good drill-down capability from aggregation to detailed data.
Operational Data Store(ODS)
An operational data store (ODS) is a type of database that's often used as an interim logical area for a data warehouse.ODS was meant to serve as the point of integration for operational systems.
For example,Banks had several independent systems-loans,checking accounts,saving accounts and so on..The teller support computers and ATM helped push many banks to create an ODS to integrate current balances and recent history from these seperate accounts under one customer number.
ODS can be used for integrating disparate data from multiple sources so that business operations, analysis and reporting can be carried out while business operations are occurring. This is the place where most of the data used in current operation is housed before it's transferred to the data warehouse for longer term storage or archiving.
An ODS is designed for relatively simple queries on small amounts of data (such as finding the status of a customer order), rather than the complex queries on large amounts of data typical of the data warehouse.
ODS
- provides recent data
- Detailed and lightly summarized data
- Subject-oriented
- Homogeneous
- Support day-to-day decisions & operational activities
- Individual records, transaction or analysis driven
Monday, December 14, 2009
Data Modelling in Data warehousing Part 2
In Data warehouse,We process large amount of data and very few updates or deletes.
The data warehouse has mixed modeling approach of relational modeling and dimensional modeling.
Relational Modeling or Entity-Relationship Modeling is used to illuminate the microscopic relationships among data elements.It removes data redundancy.It makes transaction processing very simple and deterministic.It is more suited for Traditional modeling technique, OLTP and corporate data warehouse.But for the enterprise needs,it become more complex.End users cannot understand or remember an ER model.So the dimensional model comes into picture.
From data warehouse,it is moved to Data mart which is specific to a business process. The data here is kept in denormalized form. It is mostly in dimensional model or flat model..From data mart the reports are created or the data can be pulled by OLAP system for reporting.
Dimensional modeling approach is
- best way to model decision support data.
- only technique for delivering data to end users in a data warehouse.
- a logical design technique that seeks to present the data in a standard framework.
Sunday, December 13, 2009
Data Modelling Basics Part 1
Data Modeling is a process by which the enterprise business model is defined in terms of data elements and the relationships existing among those data elements.
There are three types of data models.
1)The conceptual model mostly suits business people.
2)The logical model which is derived from the conceptual model. It suits designers. It contains entity and attributes details.
3)The physical model which is derived from the Logical model. This mostly suits the Implementers. It is database specific.The level of abstraction is highly specific.
Thursday, December 10, 2009
Data Mart
Data Mart is "Subject or Application Oriented Business View of Warehouse". It is a subset of the information content of a data warehouse that is stored in its own database,summarized or in detail. It is a repository for data to be used as a source for business intelligence. It is not used as part of day-to-day operations. Instead, the data mart periodically receives data from the online transactional processing (OLTP) systems. The data in the data mart is then made available to Analysis Services for creating cubes with preprocessed aggregates. A data mart is made up of measures, dimensions organized in hierarchies, and attributes. Once data is organized, build the database structure for the data mart using either a star or snowflake schema.In simple terms, DataMart's are
UDM (Unified Data Modelling) makes it possible for business intelligence to be extracted right from the OLTP systems in a manner that does not put undue stress on these systems, thus eliminating the need for data marts. But there are situations still exist where a data mart may be the best choice as a source for business intelligence data.
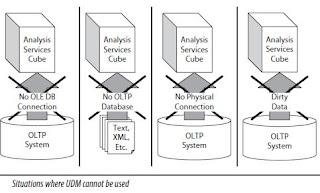
It is very difficult in practice to operationally support more than a handful of datamarts.so data warehousing comes into picture.Data warehouse is enterprise wide.It captures detailed data for the enterprise and is flexible used for ad-hoc query / analysis requirements. It has very few summary data. The data is kept in most granular form so it can be summarized later as per need.When using data marts,always design the data warehouse for full data retention,and consider storing data in archive until a requirement to analyze all the detailed data exists.
Source: Delivering Business Intelligence with Microsoft SQL Server 2012 (3rd Edition) Author: Brian Larson
.
- Quick Solution to a specific Business Problem
- can be used in Finance, Manufacturing, Sales etc.
- Smaller amount of data in datamarts can be used for Analytic Processing
UDM (Unified Data Modelling) makes it possible for business intelligence to be extracted right from the OLTP systems in a manner that does not put undue stress on these systems, thus eliminating the need for data marts. But there are situations still exist where a data mart may be the best choice as a source for business intelligence data.

It is very difficult in practice to operationally support more than a handful of datamarts.so data warehousing comes into picture.Data warehouse is enterprise wide.It captures detailed data for the enterprise and is flexible used for ad-hoc query / analysis requirements. It has very few summary data. The data is kept in most granular form so it can be summarized later as per need.When using data marts,always design the data warehouse for full data retention,and consider storing data in archive until a requirement to analyze all the detailed data exists.
Source: Delivering Business Intelligence with Microsoft SQL Server 2012 (3rd Edition) Author: Brian Larson
.
Subscribe to:
Posts (Atom)

-
 Common BI queries Relational queries Vs OLAP queries Before moving to terms used in Data warehouse, let us see the architect...
-
From yesterday onwards, I am stuck up with an error while trying to deploy cube. " You cannot deploy the model because the localhost ...
-
 CRM Involves managing all aspects of a customer’s relationship with an organization to increase customer loyalty and retention and an organ...